2.7 Measures of the Spread of the Data
Chapter Objectives
- Display data graphically and interpret the following graphs: stem-and-leaf plots, line graphs, bar graphs, frequency polygons, time series graphs, histograms, box plots, and dot plots
- Recognize, describe, and calculate the measures of location of data with quartiles and percentiles
- Recognize, describe, and calculate the measures of the center of data with mean, median, and mode
- Recognize, describe, and calculate the measures of the spread of data with variance, standard deviation, and range
Assignment
- All vocabulary (see Key Terms for definitions)
- 2.7 Homework 98–111
- Read the next section in the book
Data Spread
- Mean can tell you where the data is
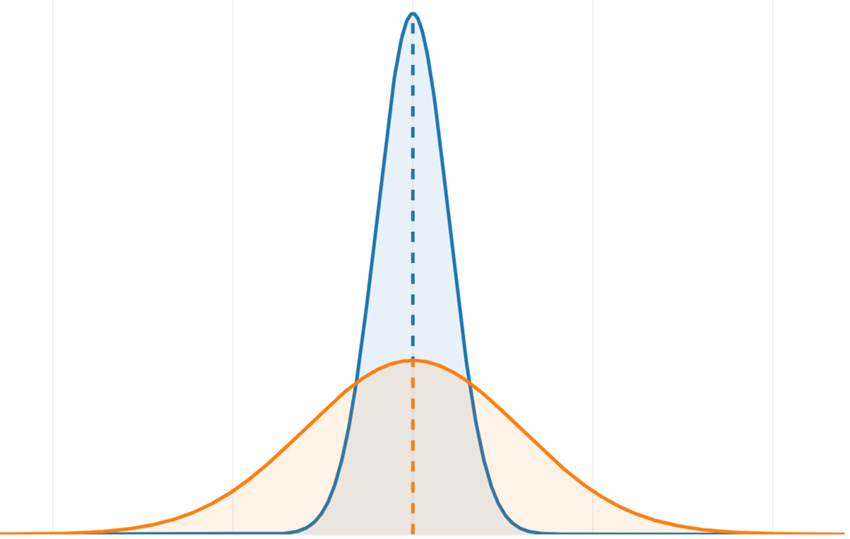
- Spread can tell you how concentrated it is at the center
- Standard deviation measures the spread of data from the mean
- This spread is also called variation
Figure 2.7.1 The orange distribution has a much higher variance than the blue distribution.
Standard Deviation as a Ruler
- A set of data has a mean of 80 and a standard deviation of 5
- A value of 85 is one standard deviation above the mean. 75 is one below. 90 would be two standard deviations.
- How many is 88?
Z-scores
Where $x$ is the value, $\mu$ the mean, and $\sigma$ the standard deviation,
\[\begin{align} z &= \frac{x - \mu}{\sigma} \end{align}\]
- Z-scores tell you how many standard deviations a data point is from the mean
- Positive is above, negative below
- 88 has a z-score of $(88−80)/5=1.6$, so 1.6 standard deviations above the mean
- 67 has a z-score of $(67−80)/5=−2.6$, or 2.6 standard deviations below the mean
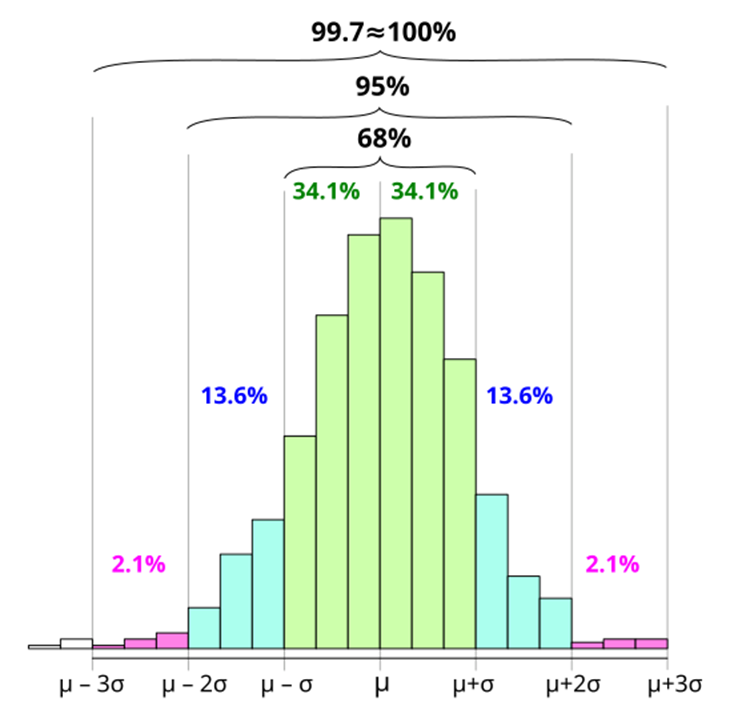
The Empirical Rule (68-95-99.7 Rule)
- A normal distribution where the bulk of the data is in the middle
- 68% of the data falls within one standard deviation
- 95% falls within two
- 99.7% falls within three
Figure 2.7.2 A visual representation of the Empirical Rule.
Calculating Standard Deviation
Standard Deviation
Where $x$ represent each data value, $\mu$ the mean, and $n$ the total number of values,
\[\begin{align} \sigma &= \sqrt{\frac{\sum (x - \mu)^2}{n}} \end{align}\]In other words,
- Find the differences between each data point and the mean
- Square each one
- Add them all up
- Divide by the number of data points
- Square root that quotient
Standard Deviation vs IQR
- Mean and standard deviation are related
- Median and IQR are also related
- First measures the center, second the spread
- Mean and standard deviation are influenced by the magnitude
- Median and IQR care only about position