2.6 Skewness and the Mean, Median, and Mode
Chapter Objectives
- Display data graphically and interpret the following graphs: stem-and-leaf plots, line graphs, bar graphs, frequency polygons, time series graphs, histograms, box plots, and dot plots
- Recognize, describe, and calculate the measures of location of data with quartiles and percentiles
- Recognize, describe, and calculate the measures of the center of data with mean, median, and mode
- Recognize, describe, and calculate the measures of the spread of data with variance, standard deviation, and range
Assignment
- All vocabulary (see Key Terms for definitions)
- 2.6 Homework 97
- Read the next section in the book
Symmetrical vs Skewed
Figure 2.6.1 A symmetrical distribution.
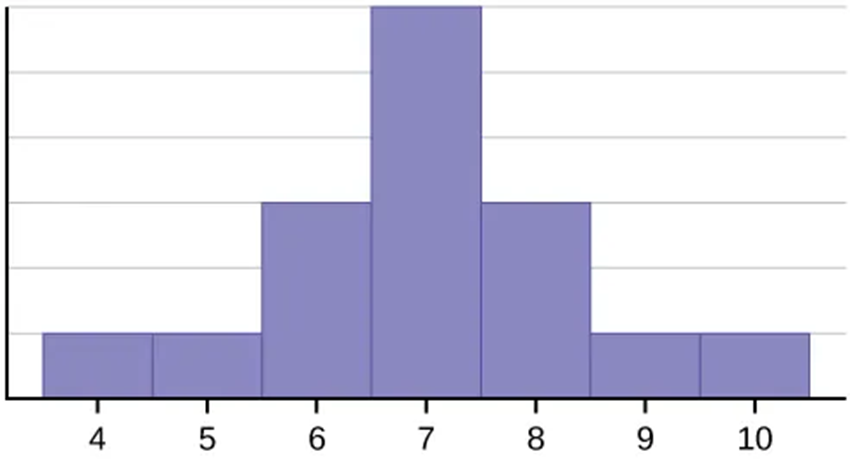
- In a symmetrical distribution, the left side is a mirror image of the right side
- Mean and the median are the same
- Skewed data is where the bulk of the data is off to the side
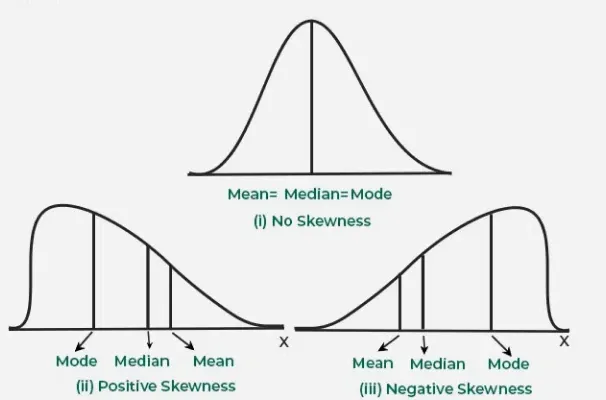
Figure 2.6.2 A or negative (left) skewed distribution and a positive (right) skewed distribution.
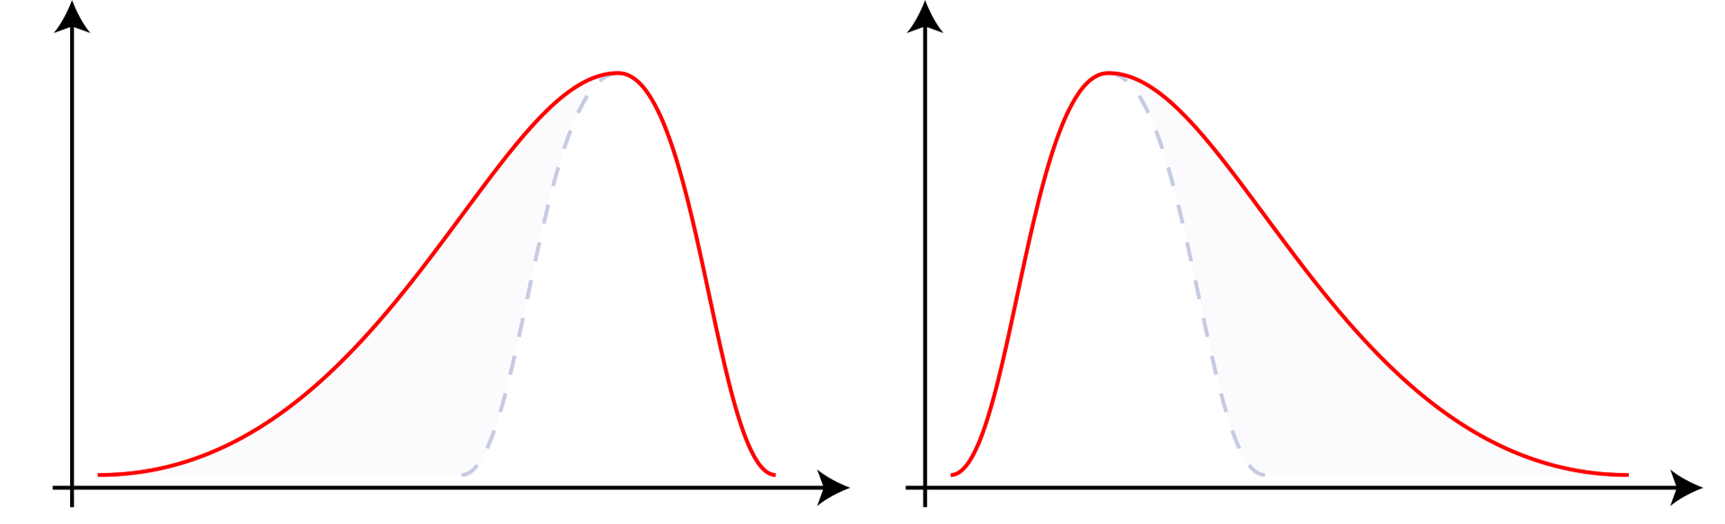
- Name is based on where the tail is
- A negative skew has a long tail on the left, or the negative side of the number line
- Positive skew has the tail on the right
- The tail drags the mean to that side, far more than the median
Figure 2.6.3 A comparison of how skew affects the different averages.