2.1 Stem-and-Leaf Graphs (Stemplots), Line Graphs, and Bar Graphs
Chapter Objectives
- Display data graphically and interpret the following graphs: stem-and-leaf plots, line graphs, bar graphs, frequency polygons, time series graphs, histograms, box plots, and dot plots
- Recognize, describe, and calculate the measures of location of data with quartiles and percentiles
- Recognize, describe, and calculate the measures of the center of data with mean, median, and mode
- Recognize, describe, and calculate the measures of the spread of data with variance, standard deviation, and range
Assignment
- All vocabulary (see Key Terms for definitions)
- 2.1 Homework 78–79
- Read the next section in the book
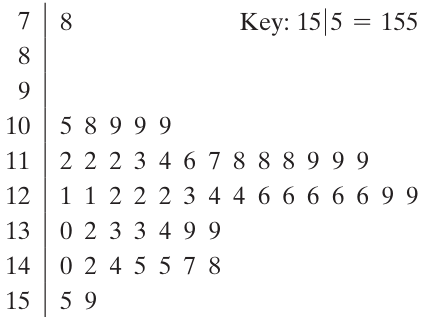
The Stem-and-Leaf Graph
- Good for small data sets
- Shape provides info on the distribution
- Can reveal outliers
- Leaf is the final significant digit
- Stem are the leading digits
- Stem on left of a vertical line
- Leaves on the right
Figure 2.1.1 A stem and leaf plot.
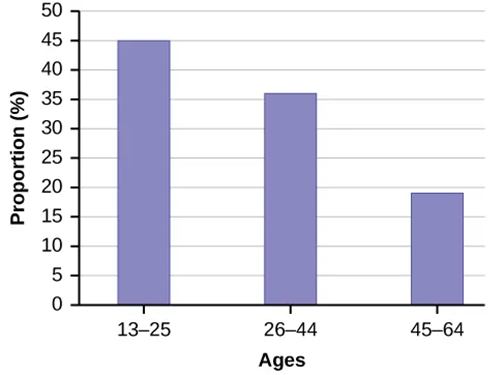
Line Graphs and Bar Graphs
- Good for representing frequency tables
- Points are plotted at frequency, then connected by lines
- Bars are the height of the frequency with space between
Figure 2.1.2 A line graph.
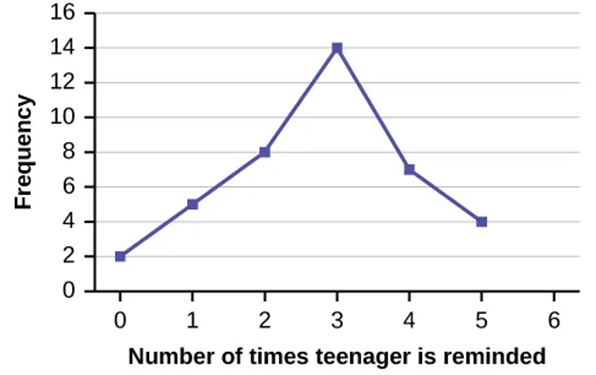
Figure 2.1.3 A bar graph.