6.2 Using the Normal Distribution
Chapter Objectives
- Recognize the normal probability distribution and apply it appropriately
- Recognize the standard normal probability distribution and apply it appropriately
- Compare normal probabilities by converting to the standard normal distribution
Assignment
- All vocabulary (see Key Terms for definitions)
- 6.2 Homework 68–72 all, 73–87 odd
- Read the next section in the book
Now that we have a handle on the normal distributions and z-scores, we can move on to probability. If you remember uniform distributions, probability was just area. In uniform distributions, area was straightforward since uniform distributions are just rectangles.
With a normal distribution, determining the area is much more complicated. So complicated in fact, that tables are used to look up the areas.
Open this PDF in a new tab: Standard Normal Probabilities. You’ll notice a picture of a normal distribution with a shaded area and a lot of numbers underneath it.
Figure 6.2.1 A partial view of the table of z-scores and their associated areas under the normal distribution.
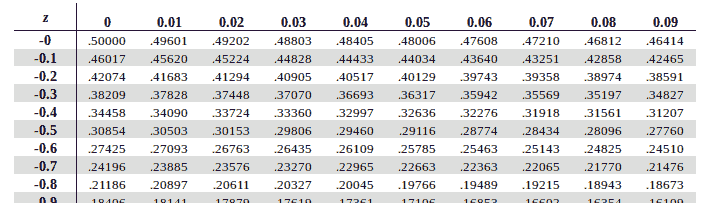
The first column is where you start. Look at your z-score and find the row that matches the sign, ones and tenths place. Then move across to match the hundredths place. For example, a z-score of −0.12 will yield a value of 0.45224. That means that 45.224% of data falls below that z-score. If you were to pick a data point at random, there is a 45.224% chance it will be in that area.
Above and Between
The table only gives you what portion falls below that z-score. Since the total area under the curve is 1, subtraction will give you what’s above that score. A _z_score of −0.85 yields 0.19766, meaning 0.80234, or about 80%, of the data lies above that score.
If you need to find the proportion between two z-scores, you will need to look up both values on the table, but subtract the smaller one from the larger.
Figure 6.2.2 Between two z-scores.
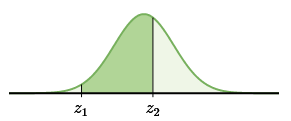
The larger one will give you everything below that point, but you want to remove the part below the lower boundary, hence the subtraction. Just be mindful that you don’t subtract the z-scores though, just the values they yield in the table.