3.5 Tree and Venn Diagrams
Chapter Objectives
- Understand and use the terminology of probability
- Determine whether two events are mutually exclusive and whether two events are independent
- Calculate probabilities using the addition rules and multiplication rules
- Construct and interpret contingency tables
- Construct and interpret Venn diagrams
- Construct and interpret tree diagrams
Assignment
- All vocabulary (see Key Terms for definitions)
- 3.5 Homework 113–115
- Read the next section in the book
Like last section, there really isn’t new material, just working with a different view of probability. This time, using tree diagrams and Venn diagrams to visualize a situation. Tree diagrams use a branching graph to show the outcome of multiple, while Venn diagrams show the relationship between outcomes of an experiment using overlapping circles or ovals.
Figure 3.5.1 A tree diagram showing the probability of drawing blue and red marbles from a bag without replacement.
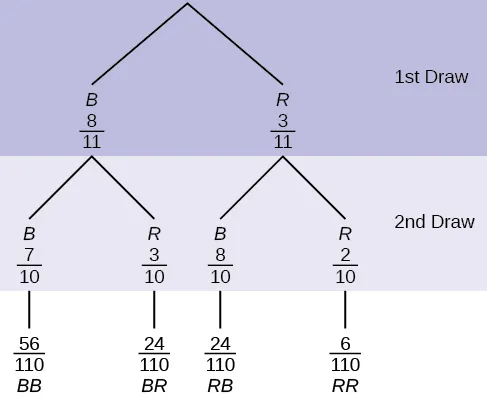
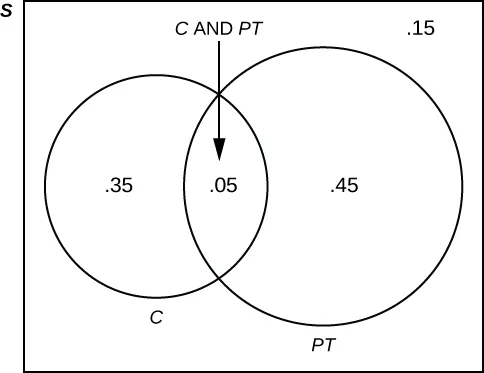
Figure 3.5.2 A Venn diagram showing that $40\%$ of students belong to a club of the time, $50\%$ work part-time, while $5\%$ both belong to a club and work part-time.