2.4 Box Plots
Chapter Objectives
- Display data graphically and interpret the following graphs: stem-and-leaf plots, line graphs, bar graphs, frequency polygons, time series graphs, histograms, box plots, and dot plots
- Recognize, describe, and calculate the measures of location of data with quartiles and percentiles
- Recognize, describe, and calculate the measures of the center of data with mean, median, and mode
- Recognize, describe, and calculate the measures of the spread of data with variance, standard deviation, and range
Assignment
- All vocabulary (see Key Terms for definitions)
- 2.4 Homework 90–94
- Read the next section in the book
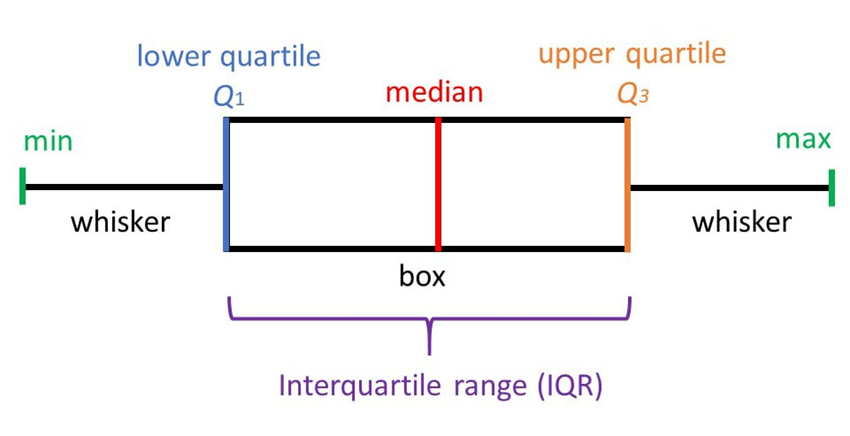
Box Plots
- Uses positional measurements to show concentration of data
- Min, max, median, $𝑄_1$ and $𝑄_3$
- The middle 50% is the box
- Whiskers go out to the min and max
- Median is drawn inside the box
Figure 2.4.1 A box plot.
Drawing a Box Plot
- Start with a properly scaled number line
- Draw vertical lines at $𝑄_1$ and $𝑄_3$. Lines should be the same length
- Create a box from those two lines
- Draw the median inside the box
- Mark the minimum and maximum
- Draw whiskers to them from the box